Teams | Collaboration | Customer Service | Project Management

Dashboards

A 5-minute guide to KPI reports (plus tips to build your own)

You spent the whole quarter collecting data about your new website design. You tracked a ton of KPIs, from traffic fluctuations to bounce rates. It's time to show your manager the success of your redesign. How do you do that? With KPI reports. A great KPI report doesn’t just showcase the data you collected; it also presents an argument for the next steps your organization should take.

How Geckoboard dashboards help India's largest online furniture rental company deliver incredible customer service

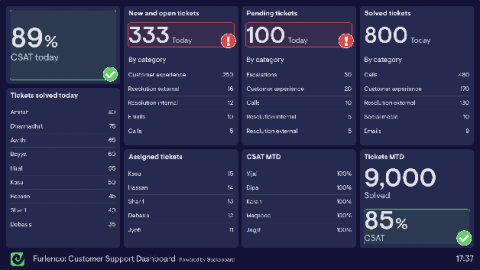
Continuing our series of Geckoboard customer interviews focused on KPIs, goal setting frameworks and dashboards, we speak to Sandeep Jindal, Head of Customer Support at Furlenco. In this post we cover how India’s largest online furniture rental company uses Geckoboard dashboards to monitor their most important Customer Support metrics, what they did to increase CSAT from 75% to 85%, how they’ve been impacted by Covid and much more.

How Five Doors Network Real Estate use dashboards to stay on top

In the first in a series of Geckoboard customer interviews focused on KPIs, goal setting frameworks and dashboards, we speak to Michelle Jaeger (Operations) from Five Doors Network. We’ll cover how Five Doors uses the Keller Williams Four Conversations method to build a highly successful real estate team and how their dashboards allow them to monitor their most important metrics.

6 Data visualization techniques to display your key metrics

Think of a set of data visualizations like the dashboard in your car. When you look at them, it should be easy-to-absorb information at a glance—your speed, fuel amount, and so on. Likewise, data visualization techniques help your teammates and managers grasp the significance of the metrics in seconds. Speed isn’t the only advantage of data visualizations. A report found that people were, on average, 89% better at problem-solving when they looked at data represented visually.

Introducing our new Free plan

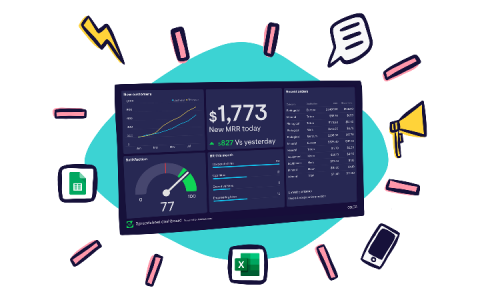
Today we’re delighted to introduce a new Free plan for anyone who wants to use Geckoboard to make a shareable dashboard using our most popular data source: spreadsheets. It’s easy to understand why spreadsheets are so popular. They’re everywhere, and the most commonly used tool for data analysis, storage and visualization. Unfortunately, they do a poor job of communicating data. Sometimes they can be difficult for others to interpret.

How to get your data into Slack

Slack has been highly popular in professional circles since it was founded in 2009, so much so that the communication app has become a verb. In the past few years it’s become ubiquitous, especially in recent times with the various lockdowns and teams going remote. If Slack’s where important conversations happen, and where your team now hangs out, it also makes sense that it’s where you share your data.

5 ways to build trust for your online shop

A guest post from Alon Eisenberg at Trusted Shops. Building trust for your website is essential to building a loyal customer base. Why? Simply put, trust is the inspiration people need to enter their credit card information on your website. Unless you’re Amazon or another really famous brand, there will be some level of hesitation from shoppers when they visit your shop for the first time.