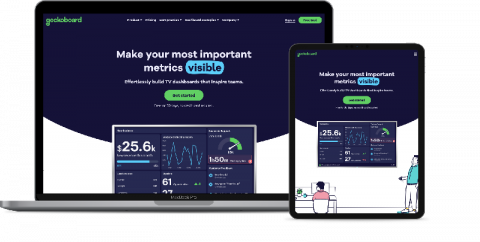
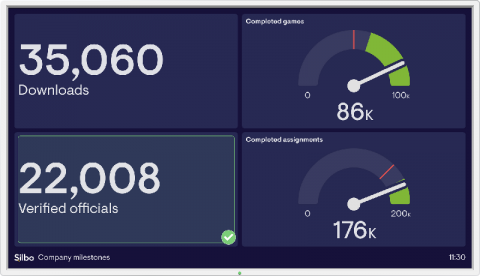
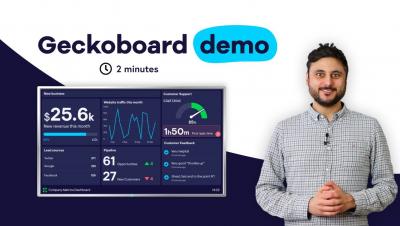
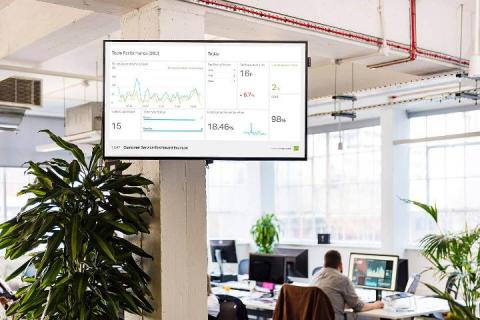
We’ve redesigned our dashboards, and added a grouping feature to make our TV dashboards the simplest, clearest way to share key numbers with your team. Oh, and we’ve rebranded too.
Is anyone not sold on the benefits of becoming more data-driven? Data brings a wealth of benefits, enabling a world where intuition, gut-feel and conjecture give way to hypotheses validated by concrete information. But even if data is the new oil, finding an effective way of extracting it is easier said than done – just like oil, it’s liable to spills, hard to refine and difficult to manage.
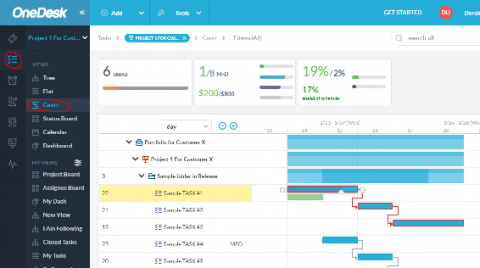
Gantt charts consist of horizontal bars that indicate a project’s schedule on a horizontal timeline. Each bar represents a task with the left end of the bar positioned at the start of the task, and the right end of the bar at the tasks finish.
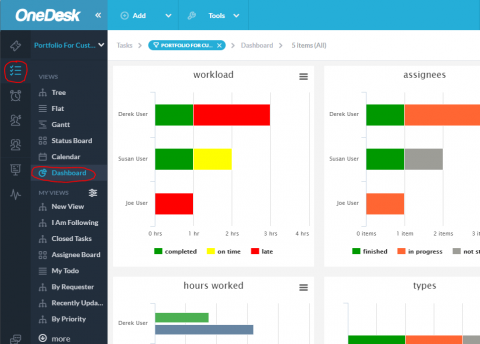
In OneDesk, dashboards are a type of ‘view’ which are displayed in the left panel and show you some useful charts and statistics about your data. You can create and save your own dashboard-views, just like you can create tree-views, card-views, gantt-views, etc.
You and your team want to make the company vision a reality. To do this, you of course need a well-defined strategy. But you also need to make that strategy crystal clear for the whole company. And your team needs to feel excited by it, pull in the same direction, and have the power to take consistent action. While most companies already aspire to work like this, it’s hard to achieve in practice. Here are some of the challenges you may be up against.