What is a Gantt chart? A guide to mapping your project timelines
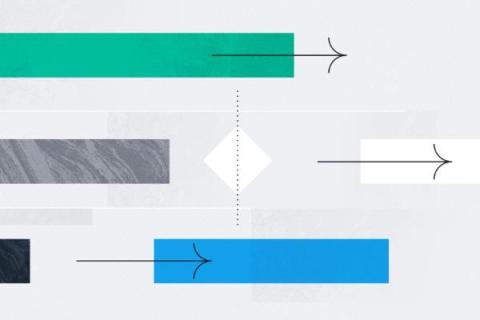
A Gantt chart is a horizontal bar chart used to illustrate a project’s schedule and related tasks or events during the project lifecycle. Find out how this type of chart can help you map tasks and keep deliverables on track. Maybe you’ve heard the term Gantt chart used around the workplace or in a project kickoff meeting. The problem is, you’re not quite sure what that is, how it helps with project management, or how to make one.


