Teams | Collaboration | Customer Service | Project Management
Dashboards
How to Easily Configure your ITSM Dashboards
4 ways you can use our new Bannerbear integration to create even better dashboards
We recently shipped a new Geckoboard integration for Bannerbear. Why should you care? Because now you can generate snazzy images and graphics that display instantly on your Geckoboard dashboard. From live weather reports, to more engaging ways to visualize customer feedback, the possibilities are endless. And the best part is, you can automate the entire process, end-to-end. What is Bannerbear?
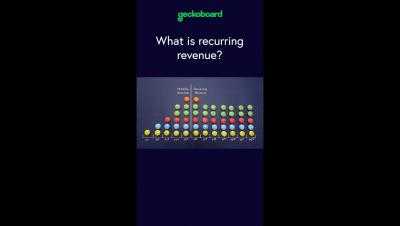
What is recurring revenue? #shorts
Monthly Recurring Revenue (MRR) & Annual Recurring Revenue (ARR) | Data Smarties
Dashboards vs. Reports in InvGate Service Desk
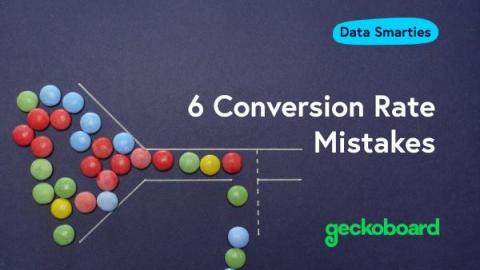
Conversion Rates & Purchase Funnels: 6 Mistakes to Avoid
In marketing and sales, purchase funnels form a crucial part of how we view the customer journey. And the most common way of measuring the effectiveness of a purchase funnel is with conversion rates. Conversion rates provide a temptingly simple way of measuring how successful each of your tactics or touchpoints has been in moving the customer along – one step nearer to that all-important final stage – the sale.
Customer dashboards: Examples of Customer Service Dashboards and Steps to Create One
One of the primary responsibilities of a customer support manager is to monitor your team’s performance and help them deliver outstanding customer service efficiently. A customer service dashboard is the perfect tool for you to track your support team’s efficiency and also know how happy your customers are with the support you offer.
6 Conversion Rate Mistakes | Data Smarties
Anscombe's Quartet - why summary metrics lie
In business, we use summary metrics all the time. A summary metric is just another way of saying you have summarized a series of data into a single data point – like a total or an average. Most of the time, when you report on business KPIs like Revenue, Customer Satisfaction, Acquisition Cost, or Lifetime Value, you’re doing so in the form of a summary metric. But summary metrics can be misleading, because they reduce complex patterns in your data down to simple, singular figures.


