6 Data visualization techniques to display your key metrics
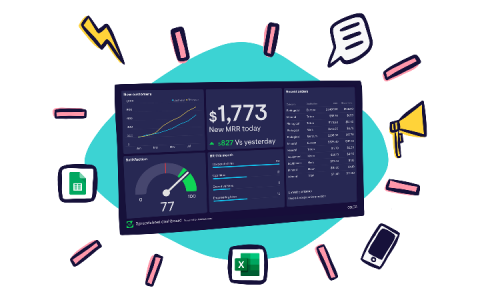
Think of a set of data visualizations like the dashboard in your car. When you look at them, it should be easy-to-absorb information at a glance—your speed, fuel amount, and so on. Likewise, data visualization techniques help your teammates and managers grasp the significance of the metrics in seconds. Speed isn’t the only advantage of data visualizations. A report found that people were, on average, 89% better at problem-solving when they looked at data represented visually.


