Geckoboard

London, UK
2010
Jun 5, 2023   |  By Dale Pearson
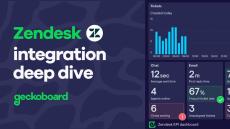
When it comes to Zendesk Explore and reporting in Zendesk, there's no denying Zendesk’s power in analyzing customer data and uncovering insights. However, even experienced users will acknowledge that Zendesk Explore can be complex to understand, and challenging to master. Perhaps you’re new to Zendesk, or are a long-time Zendesk user who’s recently been tasked with new reporting responsibilities?
May 11, 2023   |  By Sam Gane
TouchCare’s sales team recently expanded. It was at this point COO, Juliet Frerking knew it was time to bring in a system of KPIs to support the team’s growth and set them up for success. But how would she decide which KPIs to track, and which metrics to ignore?
May 5, 2023   |  By Sam Gane
When Dymatec began expansion into the US, Vaughn Newton wanted to share sales targets in a way that would make new team members across the pond feel included. What he hadn’t banked on was the profound culture change that would happen as a result of making sales figures visible to everyone.
May 5, 2023   |  By Sam Gane
At the start of 2023, Sycous’ Support agents had no access to live Zendesk data. Data Analyst, Michael Brooke would spend an hour each day creating reports for the Support Manager, and the agents would only see what was happening at monthly meetings — well past the point where they could affect what was happening. With a spare TV lying around the office, they decided to try a real-time dashboard. Spoiler alert: it was a huge success!
May 4, 2023   |  By Sam Gane
When Amir started in his role as Customer Service Director at a leading, global software company there was little structure or accountability within the Support team. They weren’t on the same page — and individual performance varied drastically. Being a remote team only amplified the problems, agents were often working in silos with no visibility of what others were doing.
May 3, 2023   |  By Sam Gane
Ralph van den Borst has been with 3D printing filament company ColorFabb for four years. When he joined, the team were using Outlook to manage their incoming tickets – they had about 240 sub-folders. He’d often hear the team say things like “we’re really busy today” or “today was a bad day” but as a data oriented person, he couldn’t grasp how they were making such statements.
Apr 27, 2023   |  By Dale Pearson
As you likely will have heard by now, Google's old Universal Analytics will finally stop processing data on July 1 2023, with the newer Google Analytics 4 (GA4) taking up the mantle. And although most businesses use Google Analytics, most businesses don’t have a dedicated analytics specialist.
Apr 21, 2023   |  By Sam Gane
Josh Hus, IT Services Manager at Veho, tells us how their internal Help Desk use Geckoboard to track workload as well as to spot ongoing issues that might need addressing.
Apr 5, 2023   |  By Sam Gane
We talk with James (Customer Experience Manager) and Tania (Deputy Customer Experience Manager) from Jigsaw about how implementing dashboards has transformed their agents' relationship with data.
Mar 23, 2023   |  By Nick Smith
Recently we shipped a new Interactive View - currently in beta - that makes it much quicker to investigate interesting changes to your metrics in Geckoboard, without jumping into more complicated tools. It’s currently available on Zendesk Support, Intercom, Facebook Ads, Google Analytics 4, Google Search Console, Shopify and Stripe widgets, on all plans.
May 2, 2023   |  By Geckoboard
Geckoboard gives you real-time Zendesk metrics, at your fingertips. That means even when it’s busy, you can respond to changes quickly and deliver the very highest standards of Customer Support.
Apr 27, 2023   |  By Geckoboard
Geckoboard gives you real-time Zendesk metrics, at your fingertips. By being aware of how you are performing in the moment, your team can respond to changes quickly and deliver the very highest standard of Customer Support.
Mar 17, 2023   |  By Geckoboard
Understand the purpose of your dashboard. Who is it for and why are they using it?
Mar 17, 2023   |  By Geckoboard
Dashboard Design Tip #2 – include only the most important content. The less content you include, the easier your dashboard will be to check 'at-a-glance'. This means your dashboard will be more useful to more people.
Mar 10, 2023   |  By Geckoboard
Looking for a custom KPI dashboard or wallboard for your business? Join Sam, Geckoboard's Customer Success Manager, for a quick run through of how Geckoboard can help you streamline KPIs and other useful real-time data, and easily share it with your team.
Mar 8, 2023   |  By Geckoboard
If you need to visualize KPIs from a SQL database, then a live SQL dashboard is the perfect solution. Dale shows us how you can use Geckoboard to create a dashboard that displays database metrics, in minutes.
Feb 13, 2023   |  By Geckoboard
Need your remote teams to be more data-driven? Dale shows us how easy it is to use Geckoboard to create and schedule automated KPI reports for Slack.
Dec 15, 2022   |  By Geckoboard
Why do so many marketers map digital metrics onto a model designed for market research? In this episode of data smarties, we take a look at the history of the classic marketing funnel, and propose a better way for small businesses (who don't have the budget for brand tracking research) to create marketing funnels they can actually measure. Chapter titles
Nov 8, 2022   |  By Geckoboard
Dale takes us through a step-by-step guide on how to set up a TV dashboard. Including what software you will need, what hardware you will need and some other important advice to bear in mind.
Oct 19, 2022   |  By Geckoboard
Dale shows us how to build a live dashboard for Google Analytics 4. A custom GA4 dashboard makes it easy to share important Google Analytics metrics with team members – via desktop, TV dashboard, Email or Slack.

Achieve more together, whatever your business. A TV dashboard ensures your metrics are front of mind for everyone, focusing teams on what matters now to move the company in the right direction.

No distractions. No unnecessary complexity. No room for misinterpretation. Our visualizations are designed with one thing in mind: to make your most important metrics clear and easy-to-understand. Build a TV dashboard in minutes using a drag-and-drop interface that makes setup and visualization changes so simple anyone can do it.

Bring Any Metric Into Geckoboard:

  • 60+ pre-built integrations: Pull live metrics from popular business tools into Geckoboard without any technical know-how.
  • Powerful Spreadsheet Integration: Effortlessly turn data tracked in a Google Sheet or Excel file into live visualizations.
  • Flexible Datasets API: Visualize metrics from databases, in-house systems and third-party software.

A different KPI dashboard, for whatever you do. There’s no ‘one dashboard fits all’ with Geckoboard. Our software makes it really easy for you to tailor TV dashboards for your team.