Teams | Collaboration | Customer Service | Project Management

Latest News

How to create a TV dashboard for Pipedrive

Pipedrive is a popular choice of CRM system for sales teams, especially in small to medium sized businesses. It provides an easy-to-use interface and powerful features that help teams manage sales performance, track progress and generate sales reports with ease. With Pipedrive, sales teams can create pipelines, assign tasks, set deadlines and monitor key metrics. They can also track leads, set targets, and view detailed analytics to gain valuable insights.

2023: The Year of Personalized Support

"Experience" has become the buzzword for quite some time now. We all think and talk about it, but it hardly ever changes anything. One reason for this is that the word "experience" (and Experience Management, for that matter) is a VERY broad term and can be leveraged for many different outcomes. However, we can take a narrow approach when it comes to service and support by focusing on just one aspect: personalized support.

How to make data accessible across your business

Several years ago, I took part in a two-day workshop at Google Digital Academy. The workshop was designed to show ‘how Google does things’ – from how they hire top talent, to how they support a culture of innovation. One of the topics that most resonated with my fellow attendees was the idea of “open data”. Open data is the principle that your company’s data should be made as accessible as possible to everyone who works there.

10 best Zendesk apps to deliver amazing support in 2023

Zendesk is one of the most popular customer service platforms on the market, and for good reason. Its user-friendly interface and robust feature set make it a great choice for businesses of all sizes. But what really takes Zendesk to the next level is its impressive app marketplace. There are over 500 apps that extend Zendesk's core functionality, many of which sit natively within the Zendesk interface.

Why we need a better way to share live data with clients

For agencies, consultancies, and even freelancers – getting your reporting right is crucial. How well you report back to your client can make or break your relationship. That’s because the reporting process goes well beyond: “did we do well this month?” It’s about demonstrating how your performance contributes to your client’s overall strategy.

Rising Support Demand Reduces Revenue

Support demand is rapidly and continuously increasing and few businesses are prepared to address the rising needs of their customers. According to TeamSupport’s State of Support report for 2022, overall support demand is rising at an average rate of 11%. That means your support team is getting more emails, more requests, more everything. Chances are that your support team is already getting hammered by the sheer volume of customer issues, not to mention the potential for complexity.

A guide to managing agent seats in Zendesk

At Geckoboard, we work with many Zendesk customers around the world. One of the great things about Zendesk is that it offers a variety of pricing plans to suit different budgets and levels of usage. A key consideration when budgeting for a Zendesk Suite plan is allocating the number of agent seats (paid user licenses) for team members you add to your account. You can choose to start with a few seats and then increase your seat count as your team grows.

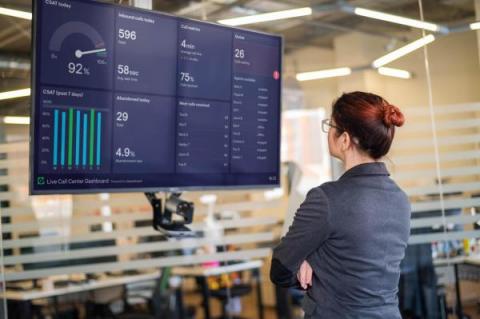
How to create a TV dashboard for Zendesk

When it comes to connecting with customers, Zendesk is a fantastic solution. From Sales teams to Customer Support, over 100,000 businesses rely on Zendesk to create seamless customer experiences. With Zendesk being such a fundamental part of many businesses' data stack, it’s not surprising that many wish to visualize their Zendesk metrics on a live TV dashboard. In this article, we’ll take you through our step-by-step guide to setting up a TV dashboard for Zendesk.

What is a data visualization dashboard?

A data visualization dashboard provides decision makers with a high-level view of their most important metrics. It combines numbers, charts, graphs, and other graphics designed to focus an audience on the metrics that matter. They can be helpful for spotting problems early, making decisions about where to allocate resources, and measuring progress over time.